Bitcoin Hits New ATH at $103,900 – Comprehensive Analysis and Report

Bitcoin, the world’s largest cryptocurrency, has reached a new all-time high of $103,900, surpassing the psychological milestone of $100,000. This event marks a significant milestone in financial markets, capturing the attention of investors and analysts worldwide. This report provides an in-depth historical, technical, and on-chain data analysis, incorporating key indicators like SOPR, exchange inflows, and address activity.
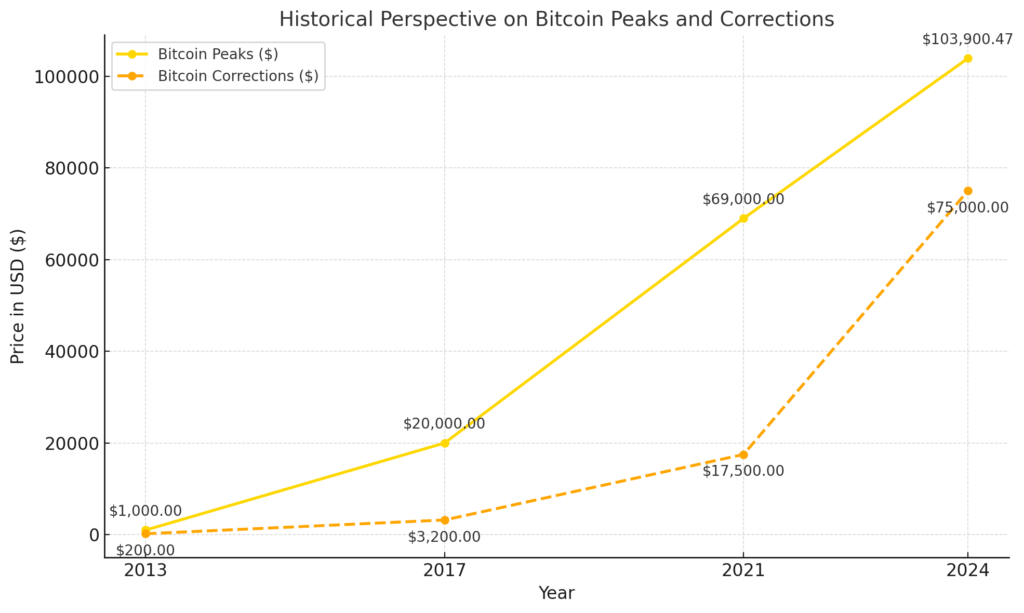
Historical Perspective on Bitcoin Peaks
Bitcoin has gone through several notable growth and correction cycles characterized by significant peaks followed by deep corrections. Here are the key historical moments:
Year 2013:
- Bitcoin reached $1,000 after a massive rally from just a few dollars.
- Following the peak, it plunged by over 80%, marking the beginning of the “crypto winter.”
Year 2017:
- The price rose to $20,000, attracting millions of new investors.
- This was followed by an 85% correction, bottoming out at around $3,200 in 2018.
Year 2021:
- In November 2021, Bitcoin hit $69,000, marking a then-record high.
- Subsequently, the price dropped by over 75%, falling below $20,000 during another “crypto winter.”
Year 2024:
- In December 2024, Bitcoin reached $103,900.47, crossing the historic $100,000 milestone.
- A correction to $70,000–$80,000 seems more likely based on technical indicators and on-chain data.
Speculative prediction for Bitcoin’s potential correction
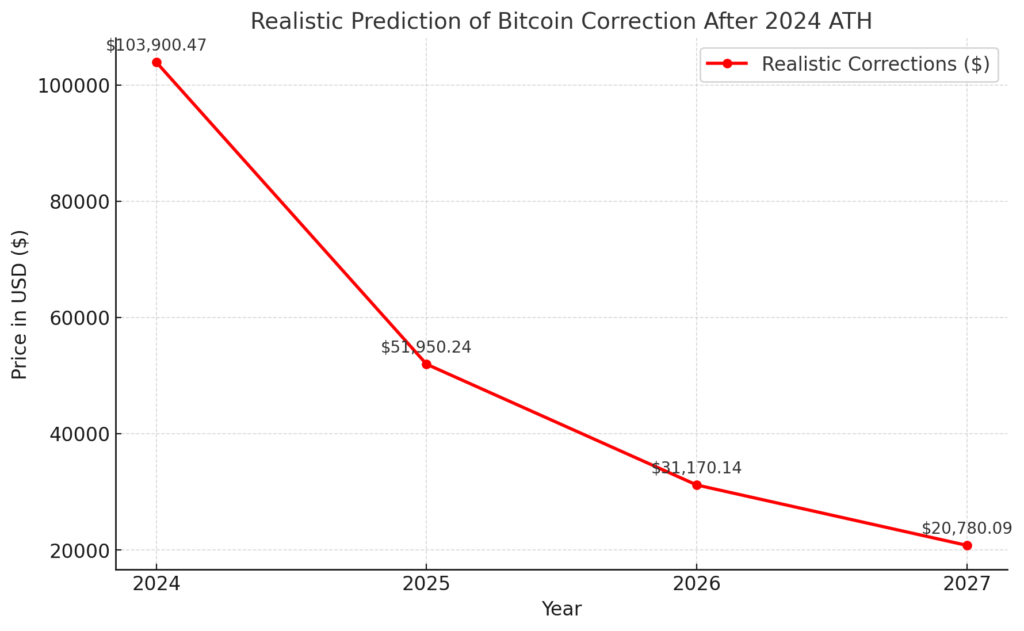
This chart presents a realistic prediction for Bitcoin’s potential correction following its 2024 ATH of $103,900.47. The scenario considers a gradual decline over three years, with price reductions to:
- 50% ($51,950) by 2025
- 70% ($31,170) by 2026
- 80% ($20,780) by 2027
A significant decline in Bitcoin’s price, similar to the one outlined in the realistic prediction, would likely be driven by a combination of several factors, including macroeconomic, regulatory, technological, and market sentiment triggers. Here’s what might contribute to such a drop:
Macroeconomic Factors
- Global Economic Recession: A major global downturn could lead investors to liquidate riskier assets like cryptocurrencies in favor of safer investments (e.g., gold, bonds).
- Rising Interest Rates: Central banks increasing interest rates can make traditional investments (e.g., savings accounts, government bonds) more attractive than volatile assets like Bitcoin.
- Strengthening of Fiat Currencies: If major fiat currencies, such as the USD, regain strength, there could be less incentive for investors to use Bitcoin as a hedge against inflation.
Regulatory Crackdowns
- Ban or Strict Regulation: Governments imposing stricter regulations or outright bans on cryptocurrency trading and mining (similar to China’s crypto ban) could severely impact Bitcoin’s adoption and price.
- Taxation Pressure: Heavier taxation on crypto transactions and holdings might discourage retail and institutional investors.
- Institutional Disengagement: Regulatory uncertainty could lead institutional investors to pull out, removing a significant source of demand.
Market Dynamics
- Loss of Market Confidence: A major security breach, failure of a prominent exchange, or insolvency of key crypto firms could erode trust in the ecosystem.
- Whale Sell-Offs: Large holders (“whales”) liquidating their Bitcoin holdings could trigger panic selling, driving the price down rapidly.
- Market Over-Leverage: Excessive leverage in the crypto market could amplify price corrections when liquidations are triggered.
Competition and Technological Factors
- Emergence of Superior Technologies: If a new blockchain or cryptocurrency solves Bitcoin’s limitations (e.g., energy consumption, scalability) and gains adoption, it could divert interest and capital away from Bitcoin.
- Major Network Issue: A serious technical vulnerability or sustained attack (e.g., a successful 51% attack) on the Bitcoin network could diminish its credibility.
Shift in Narrative
- Decline in Institutional Adoption: A shift in narrative from Bitcoin being a “digital gold” or store of value to it being considered outdated or inefficient could lead to reduced demand.
- Loss of Decentralization: If Bitcoin becomes overly centralized (e.g., dominated by a few mining pools), it might lose appeal to its core supporters.
Psychological and Speculative Factors
- Fear and Greed Cycles: Cryptocurrencies are highly sentiment-driven. Fear of a prolonged “crypto winter” could lead to widespread selling and suppress prices.
- Hype Moving Elsewhere: Investor enthusiasm shifting toward newer technologies (e.g., AI, Web3) could redirect capital away from Bitcoin.
Examples of Past Triggers
- The 2018 crash followed excessive hype in 2017, regulatory warnings, and disillusionment with ICOs.
- The 2022 bear market was fueled by rising interest rates, Terra/Luna collapse, and high-profile failures like FTX.
Mitigating Factors
For Bitcoin to avoid such a steep decline, the following would need to occur:
- Continued institutional adoption and investment.
- Favorable regulatory frameworks that encourage innovation.
- A strong macroeconomic recovery, with rising interest in cryptocurrencies as a hedge or alternative asset.
Bitcoin’s price trajectory is highly uncertain, driven by a complex interplay of factors. Understanding and preparing for these scenarios helps investors navigate the risks.
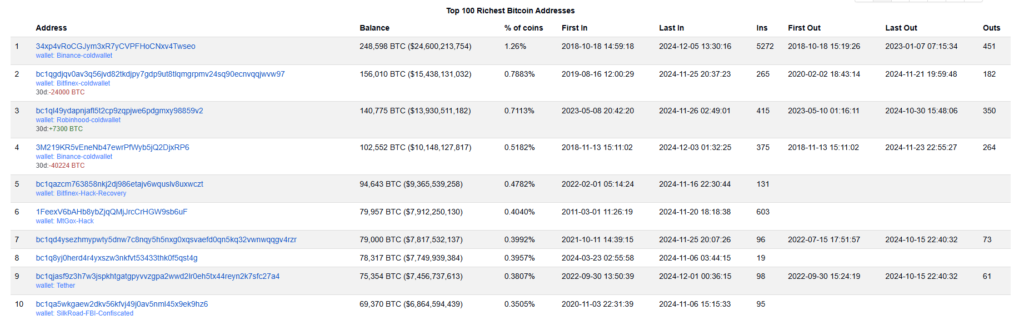
Largest Bitcoin Wallets to Monitor
Monitoring the activity of the largest Bitcoin holders, known as “whales,” can provide valuable insights into potential price movements in the market. Significant transfers or sales of large amounts of BTC by these entities may signal upcoming price changes.

Largest Bitcoin Wallets to Monitor
Binance Cold Wallet
- Address:
34xp4vRoCGJym3xR7yCVPFHoCNxv4Twseo - Balance: 248,598 BTC
- Percentage of Total Supply: 1.26%
- First Transaction: October 18, 2018
- Last Transaction: December 1, 2024
Wallet Address: bc1qgdjqv0av3q56jvd82tkdjpy7gdp9ut8tlqmgrpmv24sq90ecnvqqjwvw97
- Balance: 168,791 BTC
- Percentage of Total Supply: 0.86%
- First Transaction: February 19, 2022
- Last Transaction: December 1, 2024
Wallet Address: bc1qjasf9z3h7w3jspkhtgatgpyvvzgpa2wwd2lr0eh5tx44reyn2k7sfc27a4
- Balance: 94,506 BTC
- Percentage of Total Supply: 0.48%
- First Transaction: September 6, 2019
- Last Transaction: October 2, 2023
Wallet Address: 1LdRcdxfbSnmCYYNdeYpUnztiYzVfBEQeC
- Balance: 53,880 BTC
- Percentage of Total Supply: 0.27%
- First Transaction: May 27, 2014
- Last Transaction: October 28, 2023
Wallet Address: 37XuVSEpWW4trkfmvWzegTHQt7BdktSKUs
- Balance: 94,505 BTC
- Percentage of Total Supply: 0.48%
- First Transaction: September 6, 2019
- Last Transaction: October 2, 2023
Monitoring Whale Activity
To track the movements of these large wallets, you can use the following tools:
- BitInfoCharts: A platform offering a list of the richest Bitcoin addresses along with detailed transaction history.
- Whale Alert: A service that monitors large cryptocurrency transactions in real-time, available on Twitter and as a website.
- Glassnode: An analytics platform providing on-chain data, including whale activity insights.
Top 10 richest bitcoin adresses
Historical Whale Behavior
Analyses show that in the past, when whales began mass-selling their BTC holdings, significant price corrections often followed.
- May 2021: Large sell-offs by whales contributed to Bitcoin’s price drop from approximately $60,000 to below $30,000.
- March 2024: Whales sold BTC worth over 19 billion PLN, creating market unease and triggering sell signals.
Tracking whale movements is a useful tool for anticipating market trends, though it should be combined with other indicators for a complete market analysis.
On-Chain Data
SOPR (Spent Output Profit Ratio)
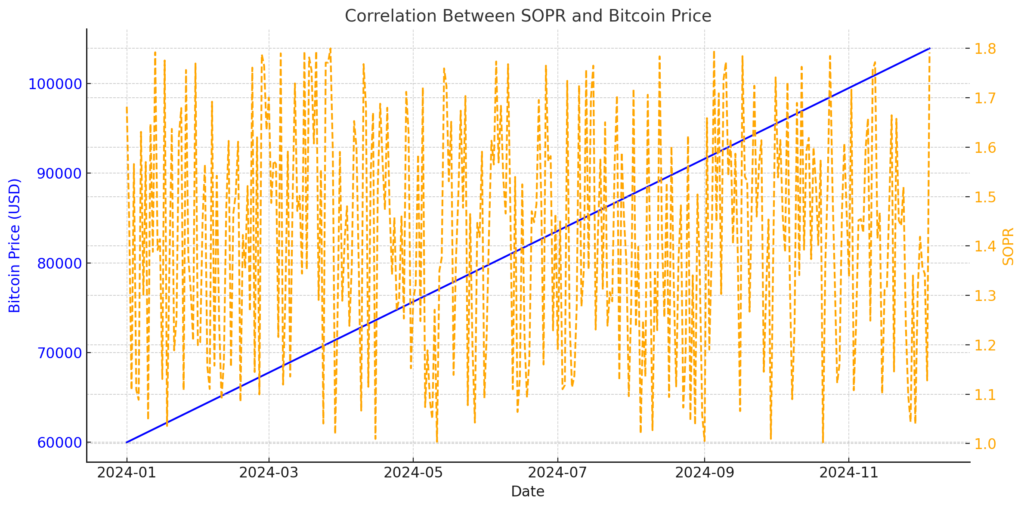
This chart visualizes the relationship between Bitcoin’s price (blue line) and the Spent Output Profit Ratio (SOPR) (orange dashed line) over time during 2024. Below are key insights and interpretations:
Bitcoin Price (Blue Line – Left Axis):
- The price steadily increases from approximately $60,000 in January to over $103,900 in December 2024.
- This trend reflects a sustained bull market, potentially fueled by strong investor sentiment and institutional participation.
SOPR (Orange Dashed Line – Right Axis):
- SOPR values remain consistently above 1 throughout the year, indicating that most Bitcoin transactions are being made at a profit.
- Significant spikes in SOPR (e.g., above 1.6–1.8) align with periods of heightened market activity, often indicative of profit-taking by investors.
- Smaller dips toward 1 reflect moments of consolidation or reduced profit margins, signaling potential market stabilization.
Key Observations
Positive Correlation:
- The chart reveals a positive correlation between Bitcoin’s price and SOPR values. As Bitcoin’s price rises, SOPR also increases, suggesting that higher prices encourage investors to sell at a profit.
Profit-Taking Cycles:
- The periodic spikes in SOPR above 1.5 suggest moments when investors are actively taking profits, potentially signaling short-term price peaks.
- These profit-taking events do not lead to sharp corrections, indicating strong market demand and confidence in the upward trend.
Sustained Bull Market:
- SOPR values consistently above 1 throughout the year support the notion of a robust bull market, where transactions are profitable, and market momentum remains positive.
Potential Implications:
- Short-Term Traders: SOPR spikes above 1.5 may be used as a signal for short-term profit-taking opportunities.
- Long-Term Investors: The steady upward trend in price, coupled with high SOPR values, reinforces the confidence in Bitcoin as a long-term investment during this period.
- Risk Management: Investors should monitor SOPR for signs of extreme spikes (e.g., above 1.8) which could precede a market correction.
Exchange Inflows:
- Recent days have shown a rise in Bitcoin flows to exchanges, reaching around 25,000 BTC daily.
- Historically, increased exchange inflows precede larger price corrections as investors prepare to sell.
Address Activity:
- The number of active addresses has reached the highest levels since the 2021 peak, suggesting new investors entering the market during the rally.
Technical Analysis
Market Overview:
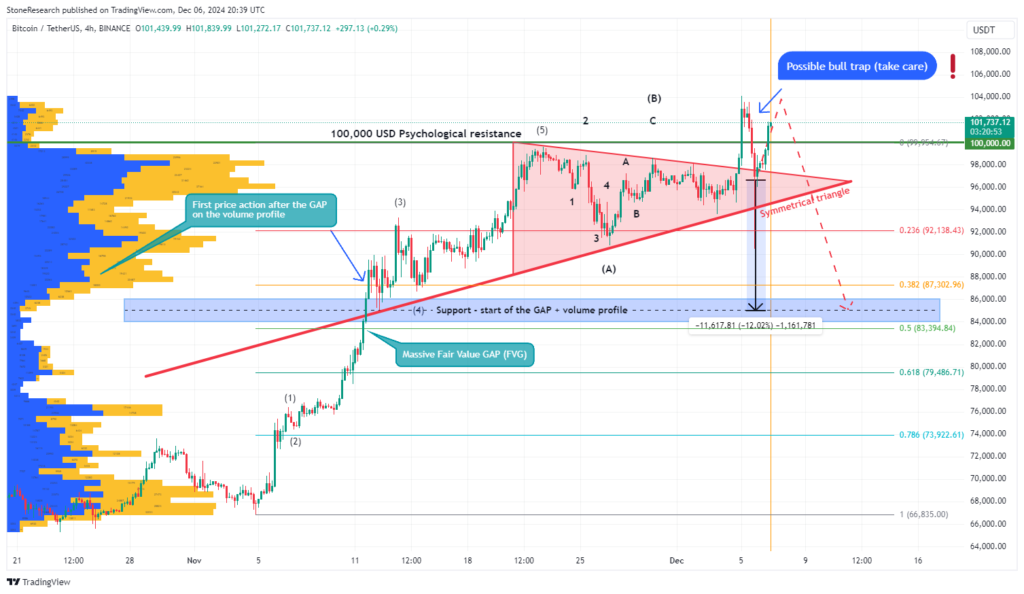
According to the analysis presented by the user Xanrox on TradingView, Bitcoin is currently at a point that could be a classic bull trap. In recent days, the price of Bitcoin has reached new highs, but the author suggests that these increases may only be part of a larger structure preparing the market for a correction or a big crash.
Support and Resistance Levels:
- Resistance Level: The chart indicates the $100,000 level, which could act as a psychological resistance. If the price reaches this level, there is a high probability of a reaction in the form of a decline.
- Support Level: An important support level is around $85,000, marking the beginning of a “Fair Value Gap” (FVG) on the daily chart. This is an area where price could stall during a correction. A break below this level could lead to further significant declines.
Technical Formation – Symmetrical Triangle:
The chart shows a symmetrical triangle formation, which typically indicates consolidation before a clear move either up or down. However, the analyst warns that a breakout to the upside may be a false breakout, leading to a bull trap, followed by a substantial correction.
Technical Indicators:
- RSI (Relative Strength Index): RSI is currently in the overbought zone, suggesting that the market may be overheated, and prices could soon begin to decline.
- MACD: A negative MACD crossover is visible, indicating weakening bullish momentum and the potential for a trend reversal.
- Volume: The chart shows decreasing volume during the recent upward movement, which suggests a lack of strength in the trend and could indicate waning demand.
Fibonacci Retracement:
Applying Fibonacci levels shows that the 38.2% retracement of the most recent upward move could be the first target for a potential decline. The next key levels are 50% and 61.8%, which might act as support if the bullish trend is broken.
Summary of the Scenario:
The analysis suggests that Bitcoin may be in the phase of an ultimate bull trap, where the current price increases are just a trap for investors expecting further gains. A significant correction could happen soon, with price likely to drop. Potential targets for the decline include support levels around $85,000 and possibly lower.
Conclusions and Strategy:
- Short Position: It is highly recommended to consider opening a short position, especially if the price of Bitcoin reaches the $100,000 level or attempts to break out of the triangle formation.
- Stop Loss: A stop loss above the $100,000 level could protect the position in case of unexpected upside movement.
- Targets for the Short: The first target for the decline is the $85,000 level, with further support at $80,000 or lower.
Summary and Conclusions
Bitcoin reaching $103,900.47 is a historic moment, drawing global investor attention. While excitement around surpassing $100,000 is high, technical, historical, and on-chain data indicate potential correction risks.
- Short- to medium-term risks: Profit-taking by investors could lead to price drops.
- Long-term potential: Bitcoin remains a key asset in the crypto ecosystem with tremendous growth potential in the coming years.
Investor Recommendations:
- Regularly monitor on-chain data like SOPR, exchange flows, and address activity.
- Consider a low-leverage short strategy if technical and on-chain data suggest a correction.
- Long-term holders may still find value in maintaining positions, given Bitcoin’s fundamental strength.
Source:
https://cryptopotato.com/this-metric-suggests-btc-could-see-sharp-uptick-within-the-next-2-months/
https://en.macromicro.me/series/35106/bitcoin-sopr
https://www.coingecko.com/en/coins/bitcoin/historical_data
https://cointelegraph.com/news/biggest-us-dollar-gains-ever-5-things-bitcoin-this-week
https://bgeometrics.com/bitcoin-realized-price-3/
https://bitinfocharts.com/top-100-richest-bitcoin-addresses.html
Disclaimer: This is not financial or investment advice. You are responsible for any capital-related decisions you make, and only you are accountable for the results.