Buffet Indicator

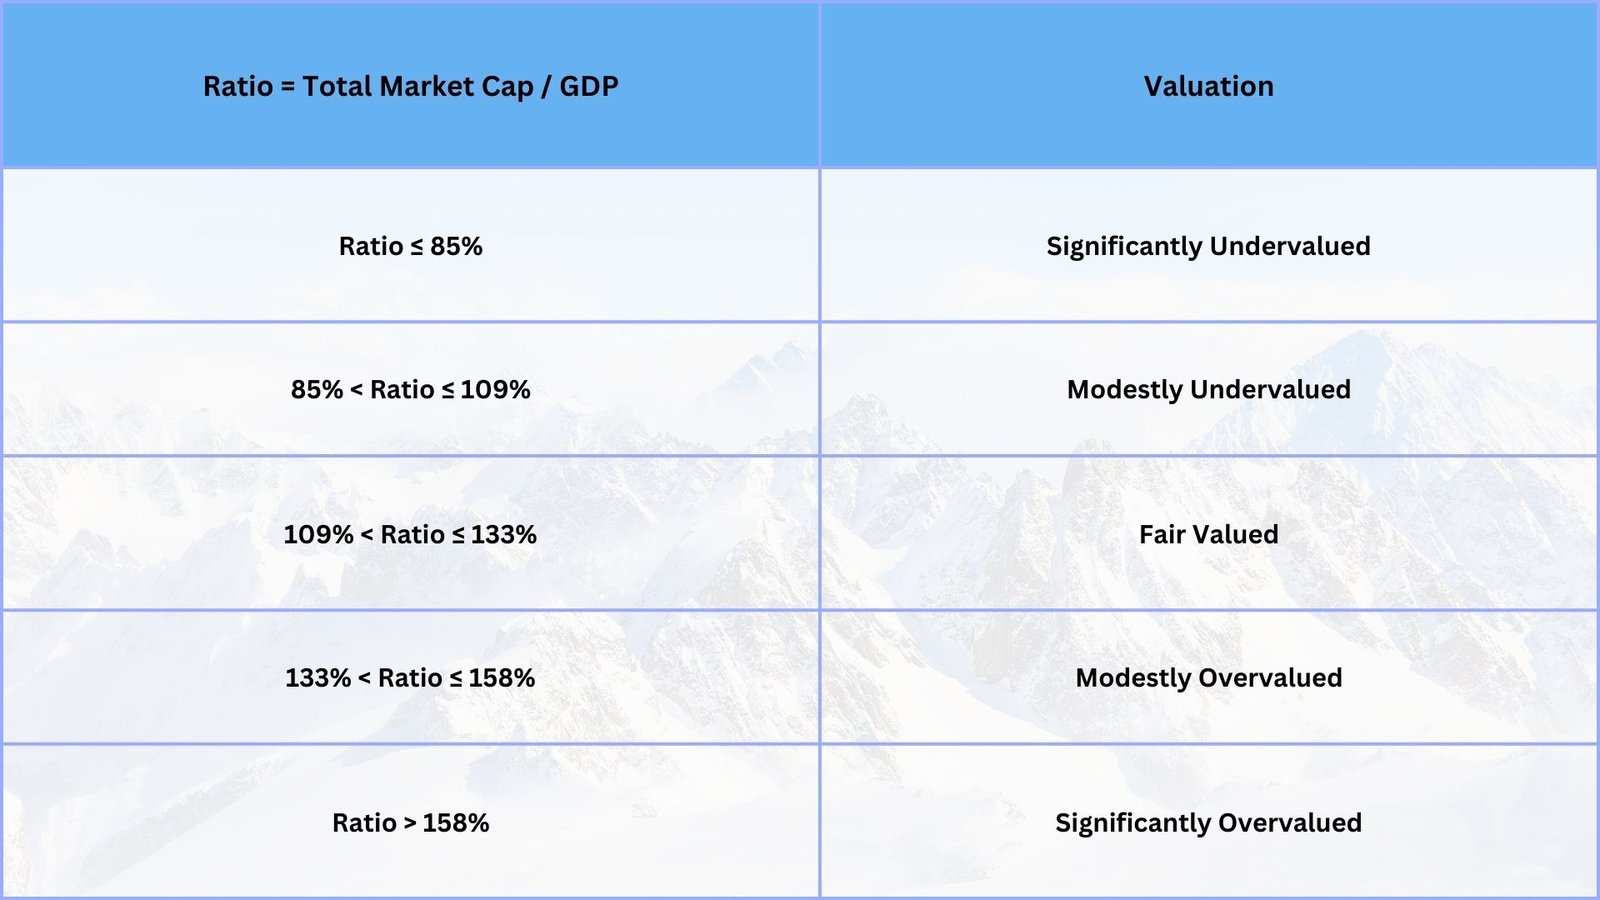
The Buffett Indicator is a valuation metric that compares the total market capitalization of a country’s stock market to its Gross Domestic Product (GDP). It is often used to assess whether the stock market is overvalued or undervalued relative to the economy.
Interpretation:
- Buffett Indicator = (Total Stock Market Capitalization / GDP) × 100
A ratio below 100% suggests that the market is undervalued.
A ratio around 100% indicates that the market is fairly valued.
A ratio above 100%, especially over 150-200%, suggests that the market may be overvalued and at risk of a correction.
Warren Buffett himself has called this indicator “probably the best single measure of where valuations stand at any given moment.” However, it should be used alongside other indicators, as factors like interest rates and corporate earnings growth can also influence market valuations.
📈 Buffett Indicator
💰 Warren Buffett’s Cash Reserves
Total Cash & Equivalents of Berkshire Hathaway (in Billions USD)